
Smart Infrastructure
through product tracking
What is smart infrastructure?
There is a lot of talk about “smart” things, infrastructure included. But what does that really mean?
In this report we answer the question and describe the opportunity that smart infrastructure provides for addressing the investment gap between current spending and the (much greater) need for new investment over the next 20 years. There are many other benefits to smart infrastructure but this is the most fundamental and, perhaps, the most promising.
Smart infrastructure defined
In our view, what makes infrastructure “smart” is its ability to provide information dynamically. We define it as:
Infrastructure that conveys information about its manufacturing, construction, depreciation and use to its stakeholders.
Why is it imperative to build smart infrastructure? Because it will redefine the utility of infrastructure and eliminate billions of dollars from the cost of manufacturing, construction and maintenance.
How will smart infrastructure work?
Smart infrastructure will include products and feature sets that will produce the utilities described in our definition, such as information about:

Depreciation
Strain gauges, corrosion sensors, accelerometers, etc. to record structural health
Communication of structural health data to web-hosted Management Portal
Predictive analytics about expected depreciation and future maintenance needs
Use
Sensor-generated safety warnings
Automatic communication with first-responders
Communication with public; i.e., optimal travel routes
APIs for use by app developers creating new solutions
Product manufacturing
RFID tags and/or barcodes
Product tracking software
Timeline history of manufacturing processes
Digital quality assurance records
Construction process
Digital quality assurance records
As-built information ported back to BIM model
As we will demonstrate below, the processes of manufacturing and constructing smart infrastructure will require practices that address the most pressing challenge standing in the way of fulfilling the world’s $94 trillion infrastructure need: inefficiency in the construction industry.
Opportunity
Problems creating the opportunity
Three concurrent problems converge to create a need for smart infrastructure:
The world requires $94 trillion of infrastructure investment over the next 20+ years.
The construction industry suffers from declining productivity.
Government budgets are constricting investment and maintenance funding.
1
The world requires $94 trillion of infrastructure investment over the next 20+ years.
The G20 released its Global Infrastructure Outlook to forecast infrastructure investment needs and the funding gaps relative to current spending. The forecast suggests that $94 trillion of new investment will be needed through 2040, starting with $2.7 trillion in 2019. This amount is $15 trillion more than current spending will fund, suggesting that the world will need to spend more or find ways to become almost 20% more productive in infrastructure construction.
The construction industry suffers from declining productivity.
In its report entitled Reinventing Construction: A Route to Higher Productivity, the McKinsey Global Institute reports that the construction industry lags all other major industries in productivity. In fact, the construction industry experienced a productivity decline of almost 1.5% per year from 2005 through 2014. Not surprisingly, the industry also lags in the adoption of digital technologies.
2
Government budgets are constricting construction and maintenance funding.
While investment needs are surging, the governments of developed countries are experiencing political pressure to reduce the tax burden and economic pressures that are limiting tax revenue growth.
In its Fiscal 50: State Trends and Analysis report, the PEW Charitable Trust reveals that, while 2018 state tax collections in the United States are demonstrating strong short-term growth, this proves to be the exception to the rule in the years since the Great Recession of 2007–2009. Collections in 2016 and 2017 provided the slowest tax revenue growth (outside of an economic recession) in 30 years. Tax revenues increased more slowly immediately following the Great Recession than for any of the three previous recessions.
The conclusion of the report underscores that infrastructure project managers cannot rely on tax revenues alone to fund the funding gap or additional maintenance costs of new infrastructure investments.
“But even a return to peak levels can leave states with little extra to cover costs associated with population increases, growth in Medicaid expenses, deferred needs, and accumulated debts and liabilities.”
3
The Smart Infrastructure Opportunity
There will be many public benefits to smart infrastructure that are not addressed in this report, including:
Optimized traffic management
Transportation efficiency
Real-time communication with the public
Improved safety, and
Currently unforeseen benefits from innovative apps produced by the private sector
Years from now, we may see benefits such as these as essential to our way of life; much the same as we can’t envision how we ever managed without the internet. However, the most pressing problem currently is finding a way to produce enough infrastructure to sustain our existing needs. Therefore, this report focuses on the most fundamental promise of smart infrastructure:
Smart infrastructure will drive the productivity improvements necessary to meet global infrastructure needs.
The McKinsey report details recommendations for achieving $1.6 trillion of productivity improvements, enough to fill the gap between annual infrastructure investment and the global need. As we will illustrate in the Construction Productivity section below, a substantial proportion of the recommendations involve the application of technology and new practices. In many cases, these also happen to be the solutions and practices used to manufacture and construct smart infrastructure.
The Asset Management Productivity section demonstrates how smart infrastructure will reduce the cost of asset inspections by 40% or more, saving billions of dollars annually.
The Case Studies section that concludes the report provides examples of early smart infrastructure projects that are already in place.
Construction productivity
Benefits
The McKinsey report breaks down the manufacturing and construction processes to outline areas of potential for productivity improvement (see graphic).
Of the 48-60% total potential productivity growth available, all improvements but “On-site execution” and “Capability building” are factors in the manufacturing and construction of smart infrastructure. Therefore, the construction of smart infrastructure will directly or indirectly drive productivity improvements amounting to as much as 40%.
Below are three examples:

RFID tagging
RFID tagging is the first element of smart infrastructure. Each tag serializes the product in which it is embedded and with this, any party in the supply chain can scan the tag in the piece to record or recall its product history. Product information can include:
Manufacturer
Quality control/Quality assurance information
Batch number
Production date
Construction contractor
Repair history
Maintenance history
McKinsey Productivity Application: Technology
Manufacturers subscribe to Idencia because it saves them up to 30-35% of the work to implement RFID tagging and the collection of product information. Through more efficient inventory management and reduced costs from eliminating paper record-keeping, Idencia is able to help manufacturers be successful.
Product tracking software
Information about products, that are tagged with RFID tags or barcodes, is recorded digitally and can be shared with other parties in the supply chain. For instance, the North Carolina Department of Transportation (NC DOT) requires that all its concrete vendors tag their products and share the data digitally. Idencia is a chosen solution provider for this service. With all of the information readily available, NC DOT accesses the data and downloads it into its proprietary tracking system.
The North Carolina Department of Transportation estimated that RFID tracking saves $1.2 million in annual costs of inspecting manufacturing plants.
McKinsey Productivity Application: Procurement & Supply Chain Management

Review our overview deck above
As-built information ported to BIM model
Building Information Modeling (BIM) uses web-hosted software to create 2D and 3D models of construction projects. In addition to the efficiencies it affords in design and construction collaboration, BIM models also create more efficiency for asset managers after the project is complete. Information that was entered into the original design is replaced with the “as-built” information, which is information about the products included in the construction project. Complete information about the project is housed in one place making asset maintenance more efficient, resulting in making the project “smart”.
Serializing products during manufacturing using RFID tags or barcodes enables individual information about each product to be collected and ported into the BIM model.
McKinsey Productivity Application: Design & Engineering
McKinsey specifically recommended the use of BIM systems. In its SmartMarket Report: The Business Value of BIM for Infrastructure. Dodge Data & Analytics reported that a survey of BIM users reveals the top two benefits are fewer errors and greater predictability of costs. Using data collected with a proxduct tracking process during manufacturing to port as-built information into the BIM model extends these benefits from the realm of design to the construction process as well.
As we will describe in the section that follows, smart infrastructure will also create significant advances in the productivity of asset maintenance.

Asset management productivity
Improved construction productivity is just the start
As powerful as smart infrastructure will be as a catalyst to improved construction productivity, it will produce a more direct impact in reducing the costs of managing infrastructure. Specifically, the inspection process.
The American Society of Civil Engineers (ASCE) reports that there are 614,387 bridges in the United States. The Federal Highway Administration requires that bridges must be inspected every two years. Estimations of the average cost of inspection range between $5,000 and $15,000. Therefore, the cost of inspecting bridges in the United States is somewhere between $1.5 billion and $4.5 billion annually.
This is just the cost of inspecting bridges and only in the United States. Considering that inspections are also required for tunnels, highways, water infrastructure and more throughout the world, it is likely that the aggregate global cost of inspections conservatively ranges between $15 billion and $25 billion annually.
The cost is so high because inspections are conducted manually using paper records. In its paper, Design of a Bridge Inspection System (BIS) to Reduce Time and Cost, the Department of Systems Engineering and Operations research at George Mason University outlined the steps of a bridge inspection process (see graphic).

Without creating digital records during construction, all of the steps involving review require the search and analysis of paper records. The inspection process itself is entirely manual, which costs in labor, time and, sometimes, safety.
Compounding these costs, the current state of poor infrastructure repair in the United States compels that more resources be dedicated to inspections. In its Infrastructure Report Card, the ASCE grades the overall state of United State’s infrastructure as a “D+” and states that more than 56,000 bridges were “Structurally Deficient” at the time of its writing. Structurally Deficient bridges must be inspected every year, thereby doubling the inspection cost.
Given the resource allocation pressures on states cited earlier in this report, reducing the cost of asset maintenance is essential to the quality and safety of our infrastructure.
The smart infrastructure solution
Another look at the bridge inspection process reveals where time and costs can be saved from equipping the bridge during construction with RFID product tracking and sensor data collection (see graphic).
As previously stated, the time and cost of searching for and reviewing records will be reduced through the use of digital records produced from RFID product tracking. While a physical examination of the bridge will still be required, having sensor data delivered digitally will minimize inspection time by:
Reducing the scope of the physical examination needed
Enabling trend analyses that highlight potential problem areas before inspection
Enabling predictive maintenance practices

Example
In Design of a Bridge Inspection System (BIS) to Reduce Time and Cost, George Mason University proposed a study to compare various alternatives for inspecting the Theodore Roosevelt Bridge spanning the Potomac River between Washington, DC and Virginia.
Having identified metal fatigue and concrete cracking/section loss as the primary factors in bridge deterioration, the study reviews the use of piezoelectric accelerometers which convert vibration measures to electronic signals that can be communicated in the form of data.
Estimating that the manual cost of each inspection is $30,000, the study postulates a total cost of $750,000 to inspect the bridge over 50 years ($30,000 x 50 years / 2 years between inspections).
Including the set-up cost for equipment and assuming 25 inspections at a reduced cost, the study projects total inspection costs using accelerometers over 50 years to be $440,000, savings of more than 40%¹.
¹Costs are likely to be less today due to lower costs of processors and the use of wireless technologies. The study assumed that 65 accelerometers were connected to the processor by cable. The study also compared the cost of using drones, which presented the lowest cost. It is likely that drones will be used in combination with smart infrastructure to produce the lowest overall cost.
Case studies
Use of RFID and product tracking
To date, smart infrastructure applications (outside of research projects) have been substantially limited to RFID tagging and product information tracking. The number of these has increased in recent years. Some notable Idencia customers include:
North Carolina Department of Transportation requires that all concrete vendors deliver products with RFID tags and produce digital QA records.
Massachusetts Department of Transportation tested RFID tracking in two bridge rehabilitation projects.
Large tunnel projects are also including RFID tagging in their specifications more frequently, including these projects that used the Idencia tracking service:
Alaskan Way (SR 99) Tunnel Project, Seattle, WA, United States
Toronto Subway Extension Project, Toronto, ON, Canada
Ottawa Combined Sewage Storage Tunnel, Ottawa, ON, Canada
Projects using sensors
Seattle SR 99 Tunnel
Seattle, WA, United States
The SR 99 Tunnel in Seattle applied both product tracking and sensors during construction. Here, the sensors are primarily for public safety. As the video demonstrates, sensors are used to detect air quality issues and excessive heat from fires. Fans and sprinklers are automatically initiated and the Washington Department of Transportation command center is notified. The Washington DOT bills the tunnel as “one of the world’s smartest”.
Memorial Bridge
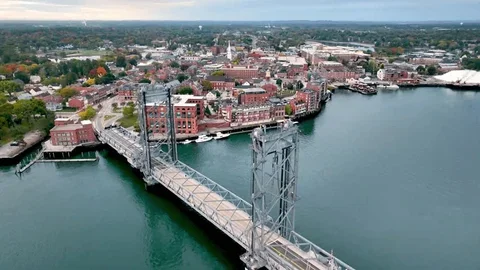
Portsmouth, NH, United States
The New Hampshire Department of Transportation partnered with the University of New Hampshire (UNH) and the National Science Foundation to outfit the Memorial Bridge in Portsmouth, NH with sensors that monitor structural health and environmental conditions. The bridge spans the Piscataqua River between Portsmouth, NH and Kittery, ME. A DSL cable communicates data to a UNH server used to monitor critical factors of structural health and environmental conditions in real-time.

Jindo Bridge
Jindo Island, South Korea
The Smart Structures Technology Laboratory at the University of Illinois partnered with KAIST (a research university in South Korea) and the University of Tokyo to equip the Jindo Bridge with a network of wireless sensors to monitor its structural health. The Jindo Bridge connects the mainland to Jindo Island and is the largest to date for a project of this kind. The project is also touted as the first monitoring system of its kind for a cable-stayed bridge.
The good news for manufacturers and managers of public infrastructure assets, is that the smart infrastructure features will be offered as services, avoiding the necessity to invest in their own. Idencia will be a leading player in this space. To learn more, check out our case study about Idencia and infrastructure projects.
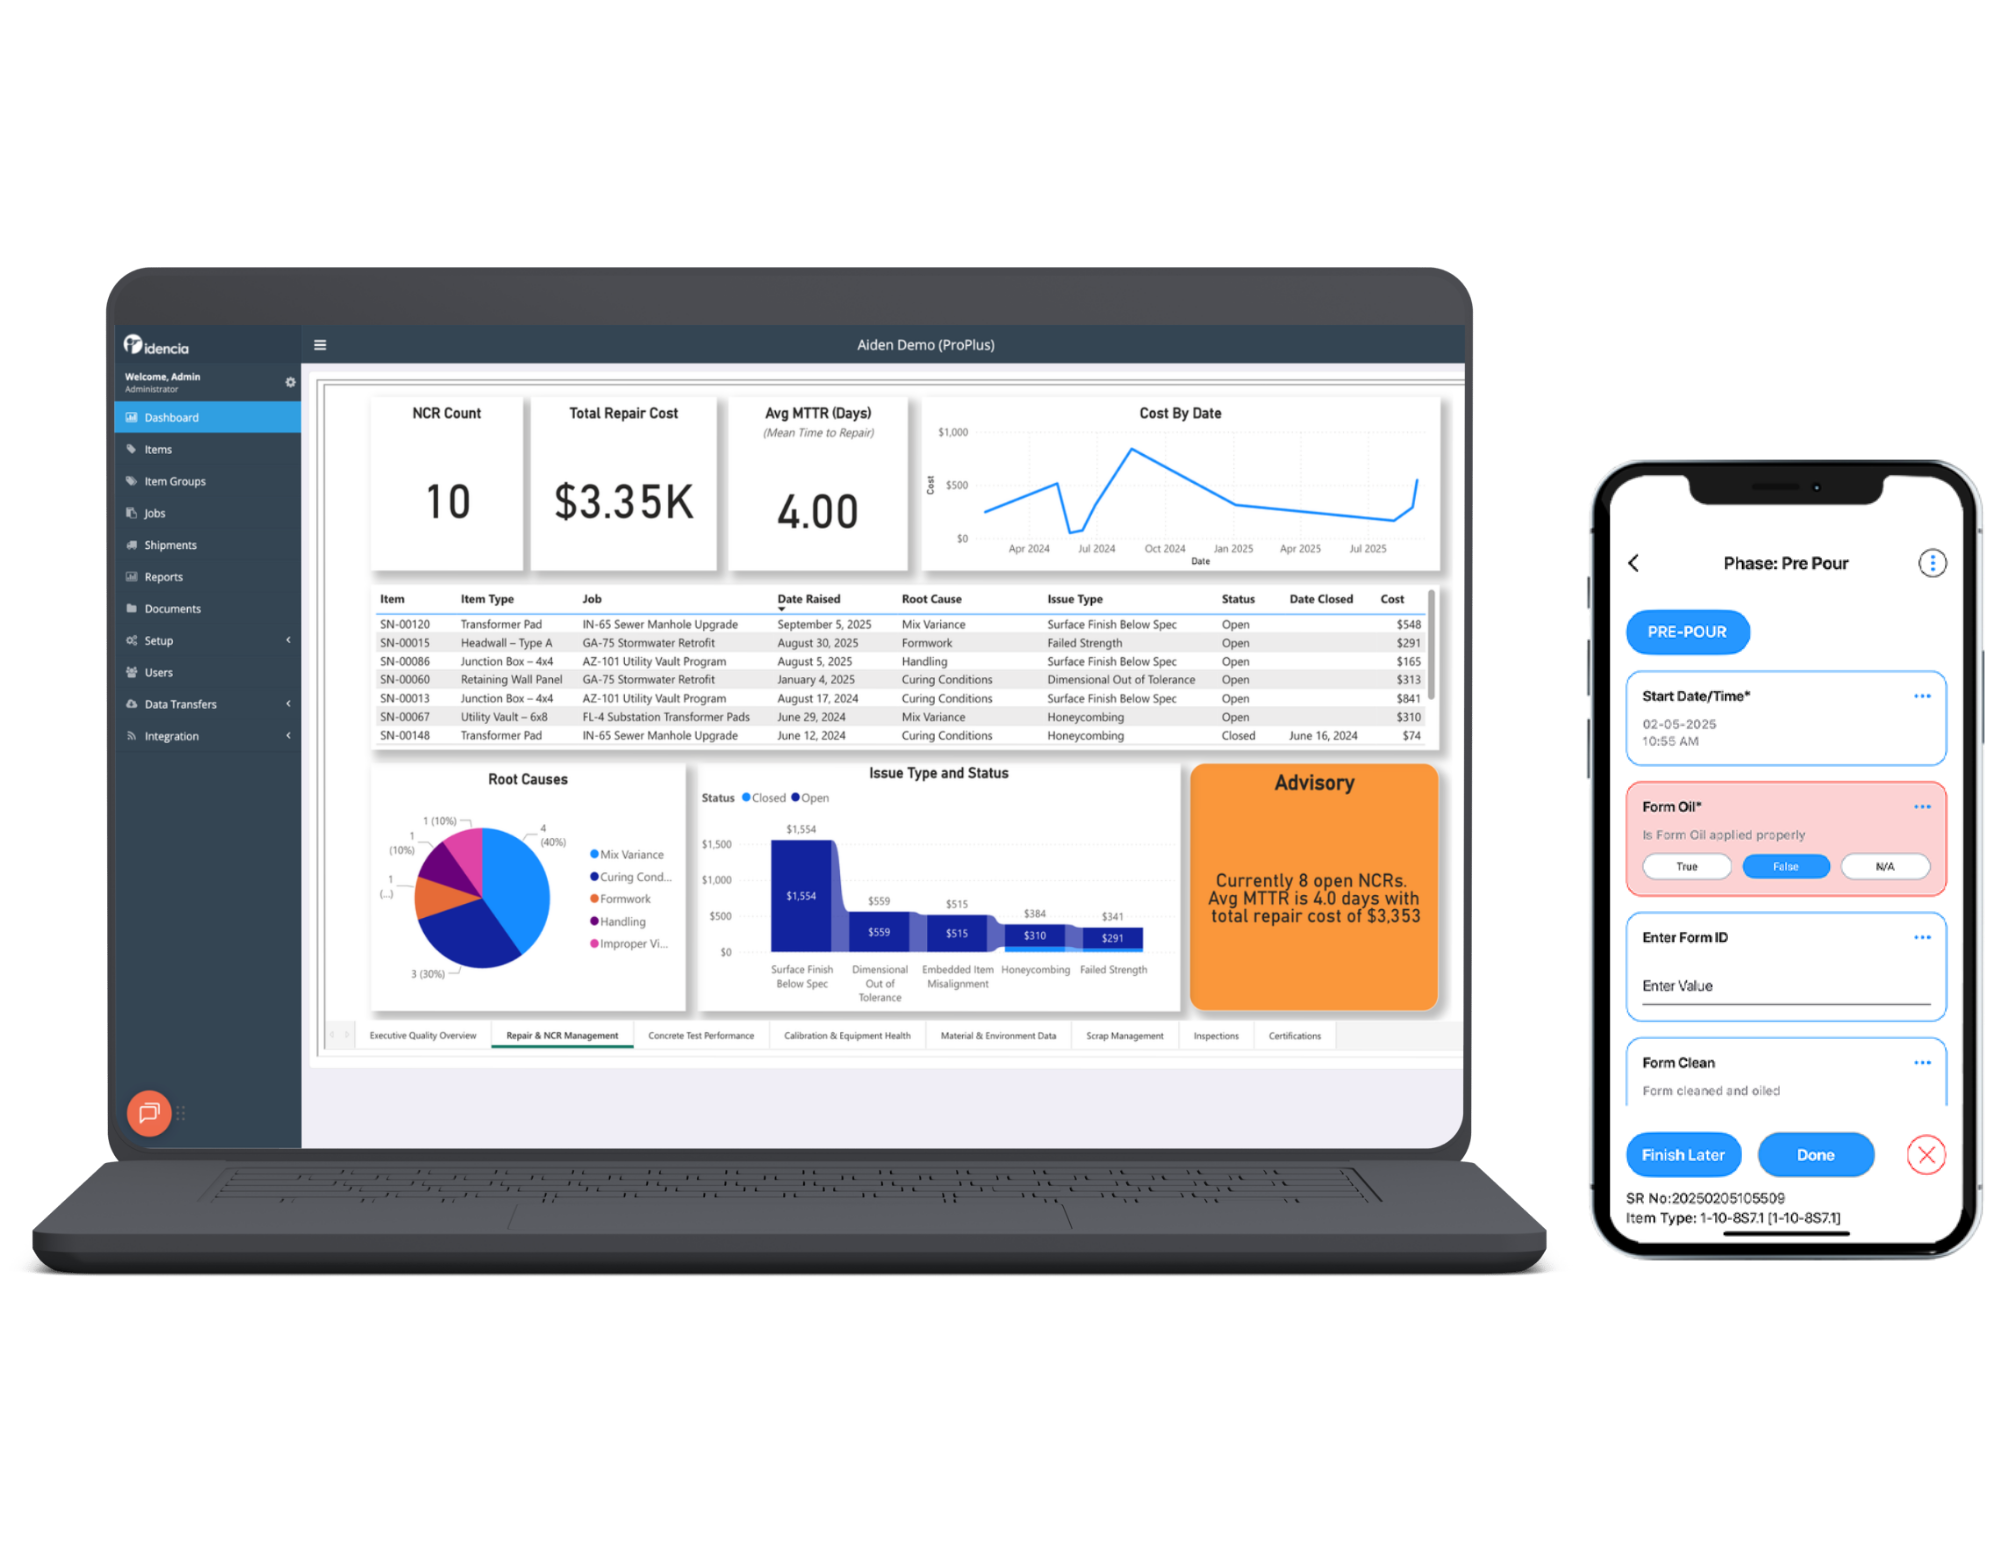
Aiden in a nutshell
Idencia Aiden is a product data tracking and plant management solution that provides tools for producers to streamline and optimize their operations. As a company, Idencia strives to benefit the precast concrete industry as a whole.
Contact us
sales@idencia.com
(603) 541-7704